It’s pretty unbelievable to look back and reflect on the fact that we launched Viz5 in March of this year. The world has certainly changed a huge amount since then, and the climate of uncertainty and volatility created by the pandemic has affected us all.
In spite of the immense challenges of the pandemic, there has been a remarkable coming together – with people all over the world working collectively to tackle problems, and advocate for those most at risk and in need.
Viz5 has been no exception. The data visualization community at Tableau and #MakeoverMonday has blown us away with their engagement, passion, and participation in the work to visualize gender equality. We’d like to take this opportunity to thank this community for their commitment to Viz5. You have helped us raise awareness, advocate for vulnerable women and girls, deliver data tools to NGOs, and you’ve done it in spite of uncertainty, volatility, and personal challenges. Thank you!
In this blog we’ll share information on the data themes from July – September, summarize the progress we’ve made as a Viz5 community, and announce which visualizations have been selected as the “SuperViz” for each of these months, highlighting their creators, and congratulating them.
July – Economic Empowerment
Achieving equal economic empowerment and potential for women is a critically important target within the 2030 Agenda for Sustainable Development. SDG 5 target 5.A seeks the achievement of: equal rights to economic resources, property ownership, and financial services for women and girls, and seeks to: “undertake reforms to give women equal rights to economic resources, as well as access to ownership and control over land and other forms of property, financial services, inheritance and natural resources, in accordance with national laws.” [1]
Economic inequality and restrictions faced by women and girls are a major hindrance to international progress towards the achievement of SDG 5. In July, Viz5 wanted to highlight this theme and shine a light on some of the economic and legal factors that limit global progress.
When women are held back from equal access to economic systems and markets, their ability to access work, control their own time, lives, and even bodies, and their power to have agency in economic decision-making, at both the household level and the institutional level, is undermined. If you’d like to read more about the complex systems that prevent the economic empowerment of women check out this fact sheet.
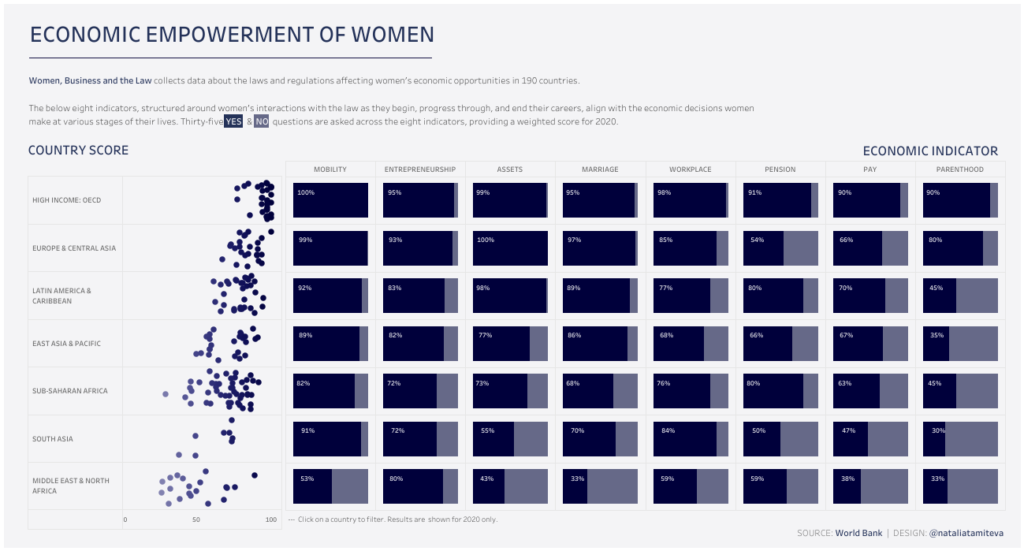
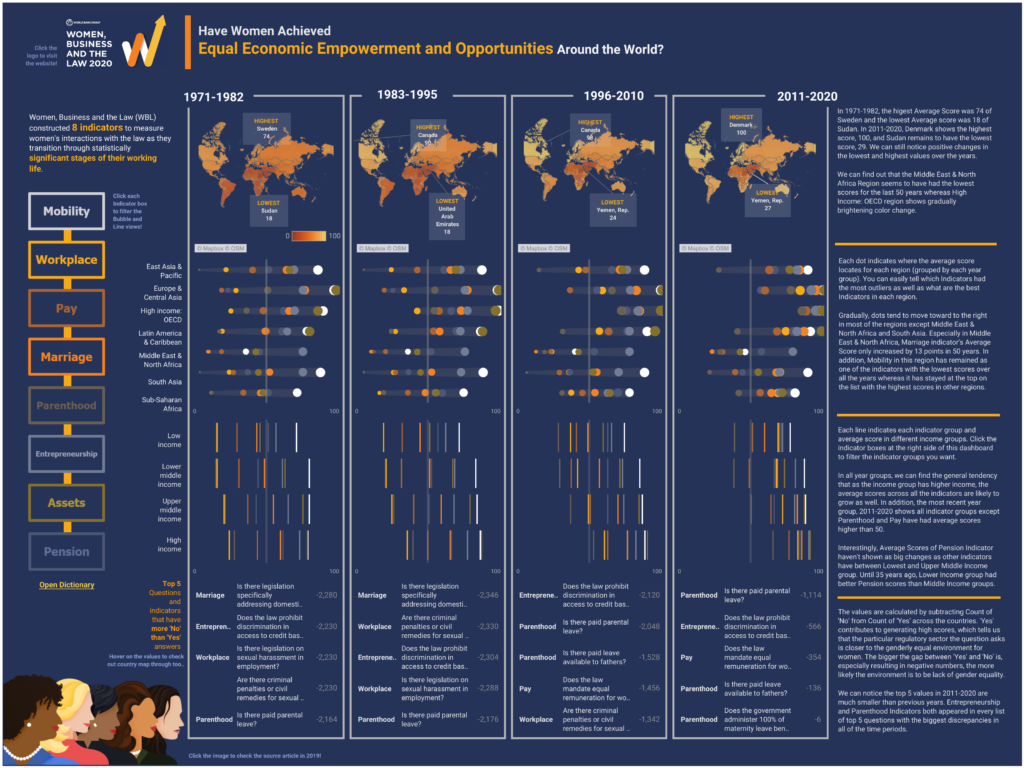
The Viz5 data that was visualized came from the World Bank project ‘Women, Business and the Law.’ This project collects data on the laws and regulations that restrict women’s economic opportunities. Women, Business and the Law have collected and shared data from 1971 to 2020. The data measures the legal differences between women’s and men’s access to economic opportunities in 190 economies. The original data tracks thirty-five aspects of the law, across 190 economies, and then scores those economies across eight indicators of four or five binary questions. The indicator score is then used to create a system to rank countries’ performance.
“Women, Business and the Law takes as its starting point that the equal participation of women and men will give every economy a chance to achieve its potential. Equality of opportunity allows women to make the choices that are best for them, their families, and their communities. It is also associated with improved economic outcomes.” [2]
The visualizations produced by the Viz5 community using this data were phenomenal, especially given the complexities of the data. There were so many stories that could be told with the data, and ultimately, we were able to showcase this data using the creative and vibrant vizzes produced by the Viz5 community.
The ‘Superviz’ for the economic empowerment data came from Natalia Miteva – @nataliamiteva. Their viz powerfully captured the global story of the data and presented a clear picture of where the deepest inequalities exist, while also showing that there is still work to be done to achieve equality in nearly every category and country surveyed, regardless of GDP status. Check out her viz!
We were also really impressed by Hailey Kim’s submission – @k2msehailey. Hailey’s visualization did an exceptional job of capturing the complexities of the World Bank report, showcasing the data, and also beautifully presenting its branding, look, and feel. Her work is detailed and comprehensive, and the whole Operation Fistula team agreed that a special commendation was in order! Take a look at Hailey’s live viz by clicking here.
The ultimate goal of Viz5 is to both raise awareness of extreme gender inequality, and catalyze global action to end it. In many of the data themes we explore specific issues – like female genital mutilation, or gender-based violence – that are symptomatic of extreme gender inequality. In August, we wanted to take a look at a systemic issue that prevents global progress in the work to achieve gender equality.
August – Women in Power
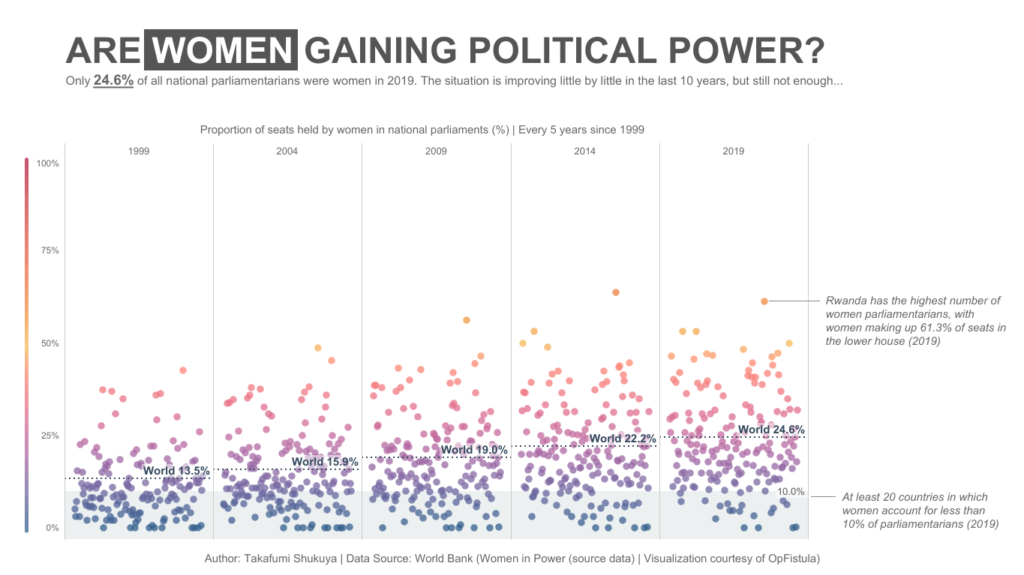
In August, the Viz5 community looked at gender inequality in the context of political appointments and parliamentary representation. The dataset came from the Inter-Parliamentary Union (IPU), but was collated by the World Bank as part of their World Development Indicators database. The data shows the proportion of seats held by women in national parliaments around the world.
SDG 5 target 5.5 seeks the achievement of: “women’s full and effective participation and equal opportunities for leadership at all levels of decision-making in political, economic, and public life.” While, the dataset Viz5 shared explored parliamentary participation at the national level, it remains true that across all positions of power and authority – as elected officials, civil service workers, private sector c-suite positions, board roles, and in academia – women are underrepresented. It comes as little surprise, therefore, that women are also less likely to be voters, and to actively participate in political systems.
“Women in every part of the world continue to be largely marginalized from the political sphere, often as a result of discriminatory laws, practices, attitudes and gender stereotypes, low levels of education, lack of access to health care and the disproportionate effect of poverty on women.” – 2011 UN General Assembly Resolution on Women’s Political Participation
Women face myriad obstacles to participating in political life. There are still many discriminatory laws and institutional practices that limit women’s capacity to run for political office. Systemic inequality, lack of access to education, limited options for workforce participation, lack of economic parity and access to income, constraints on personal freedoms, and other diverse barriers limit women from accessing the resources and opportunities to pursue political office.
The data visualizations produced using this data revealed the huge disparities in political representation and enabled the Viz5 community to advocate for action. The SuperViz selected for the theme of Women in Power was produced by Takafumi Shukuya – @O_Syringa_Z. Takafumi’s visualization summarized global trends over time to great effect – showing improvements at both the individual country and global level – while also clearly stating that progress is too slow, and that more needs to be done. Take a look!
September – Access to Contraception
In September, Viz5 exposed the challenges faced by women and girls in Low- and Middle-Income Countries (LMICs) in accessing contraception and sexual and reproductive health services.
The data featured came from Guttmacher Institute’s report: Adding It Up: Investing in Contraception and Maternal and Newborn Health, 2017. This report contains findings based on a current research project at Guttmacher Institute which assesses the need and use, as well as the cost and impact, of sexual and reproductive health services in LMICs.
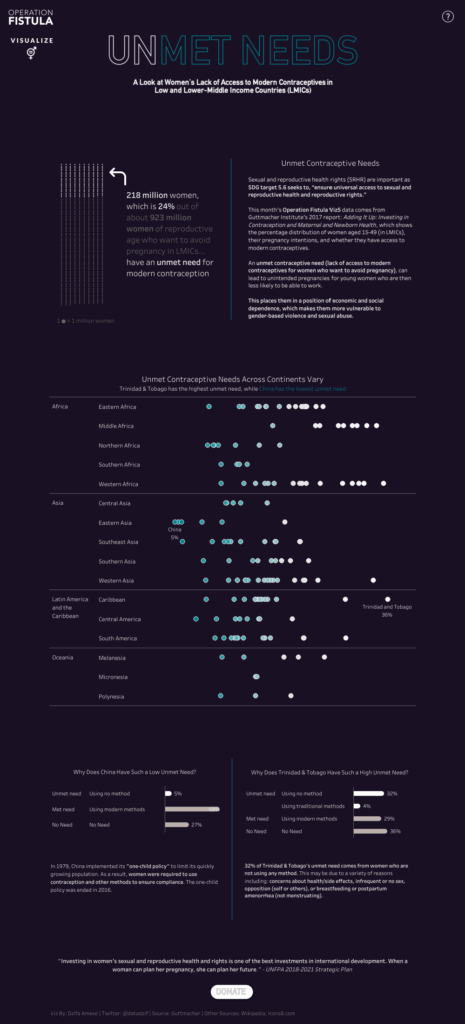
The expansion and adoption of sexual and reproductive health rights is a critical priority within SDG 5. Target 5.6 seeks to, “ensure universal access to sexual and reproductive health and reproductive rights.” Contained within target 5.6 are a number of indicators, including: “the proportion of women aged 15–49 years who make their own informed decisions regarding sexual relations, contraceptive use and reproductive health care,” and the “number of countries with laws and regulations that guarantee full and equal access to women and men aged 15 years and older to sexual and reproductive health care, information, and education.” In LMICs there are currently as many as 923 million women of reproductive age who want to avoid pregnancy. Out of that number, around 218 million have unmet need and can’t access modern contraception.
Unmet need is disproportionately high among adolescents, with 43% of the 218 million falling into the 15-19 age-group. Once pregnant, these adolescent girls often find that their journeys through education systems come to end. This makes them less likely to be able to work, placing them in a position of economic and social dependence, and increasing the likelihood that they will be victims of gender-based violence and sexual abuse. Unmet contraceptive need has a lasting impact on the health and wellbeing of these women and girls for the remainder of their lives. Beyond that, there is also a long-lasting generational impact because it places economic strain on families, and perpetuates the cycle of poverty.
Unmet need for contraception remains high in many settings, and is highest among the most vulnerable in society: adolescents, the poor, those living in rural areas and urban slums, people living with HIV, and internally displaced people…and the need is greatest where the risks of maternal mortality are highest. – World Health Organization.
We received so many deeply thoughtful, well designed, submissions for this data theme. One visualization that immediately stood out came from Dzifa Amexo – @datadzif. Their visualization not only captured every story in the dataset, but also captured the scale of the problem, and called its audience to act and advocate for change. This viz is also stunningly well designed, and the layout is striking. Dzifa’s viz is the SuperViz for this theme!
Keep a look out for more updates from #Viz5 and the visualize gender equality movement.
Want to join our community? Sign up at www.viz5.org!
About Viz5
The ultimate goal of Viz5 is to create a space where data advocacy and insights meet impact. This work seeks to ignite a data advocacy effort with the power to not only raise awareness of extreme gender inequality, but also catalyze global action to end it.
Viz5 is led by Operation Fistula, with #MakeoverMonday and Tableau Foundation operating as critical partners.
The visualizations that are produced during Viz5 will serve as advocacy tools, awareness-raising artifacts, and data-driven insight drivers for anyone working to end gender inequality.