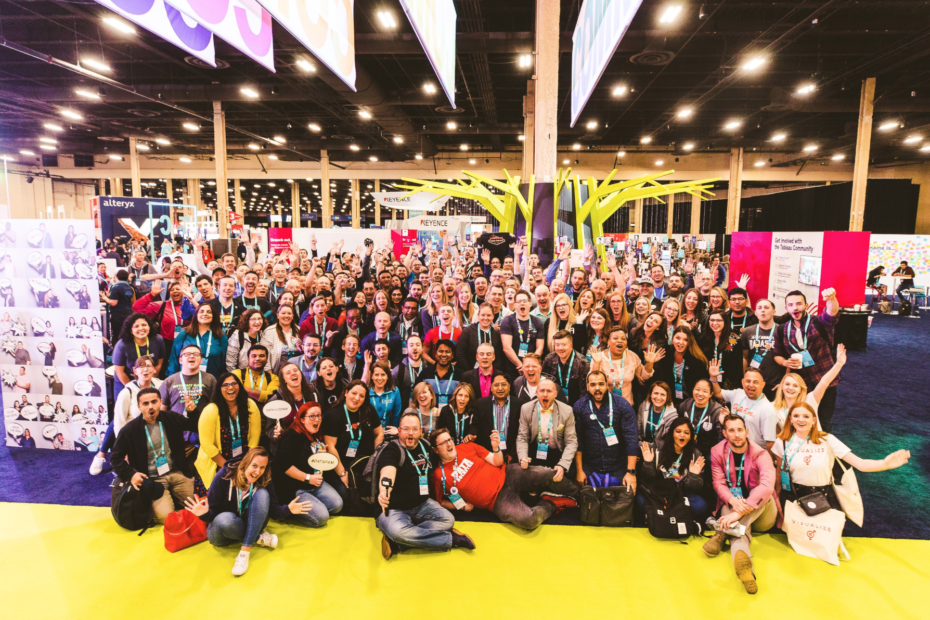
The Operation Fistula team is currently recuperating from jet-lag following their attendance at this year’s Tableau Conference – or TC19 – hosted in Las Vegas. We wanted to share a post with the highlights from our time with the Tableau community last week.
A constant theme of the conference was the importance of building a data-driven organization. Being data-driven has been a fundamental part of how Operation Fistula thinks about the execution of our work, and the achievement of our vision and values, from the very beginning. The opening plenary at TC19 was clear, that data and data analysis is essential for organizational decision-making, strategic-planning, and management. Beyond this, the resounding message was that data is, and must be, for everybody.
The keynote told the story of the inspiring American women cryptographers that broke Japanese and German military codes during World War II. A true testament to the power of women, and an even more powerful reminder of what can be achieved when equal opportunities exist for everyone. This story of the “Code Girls” made this year’s Data + Women community event particularly poignant.
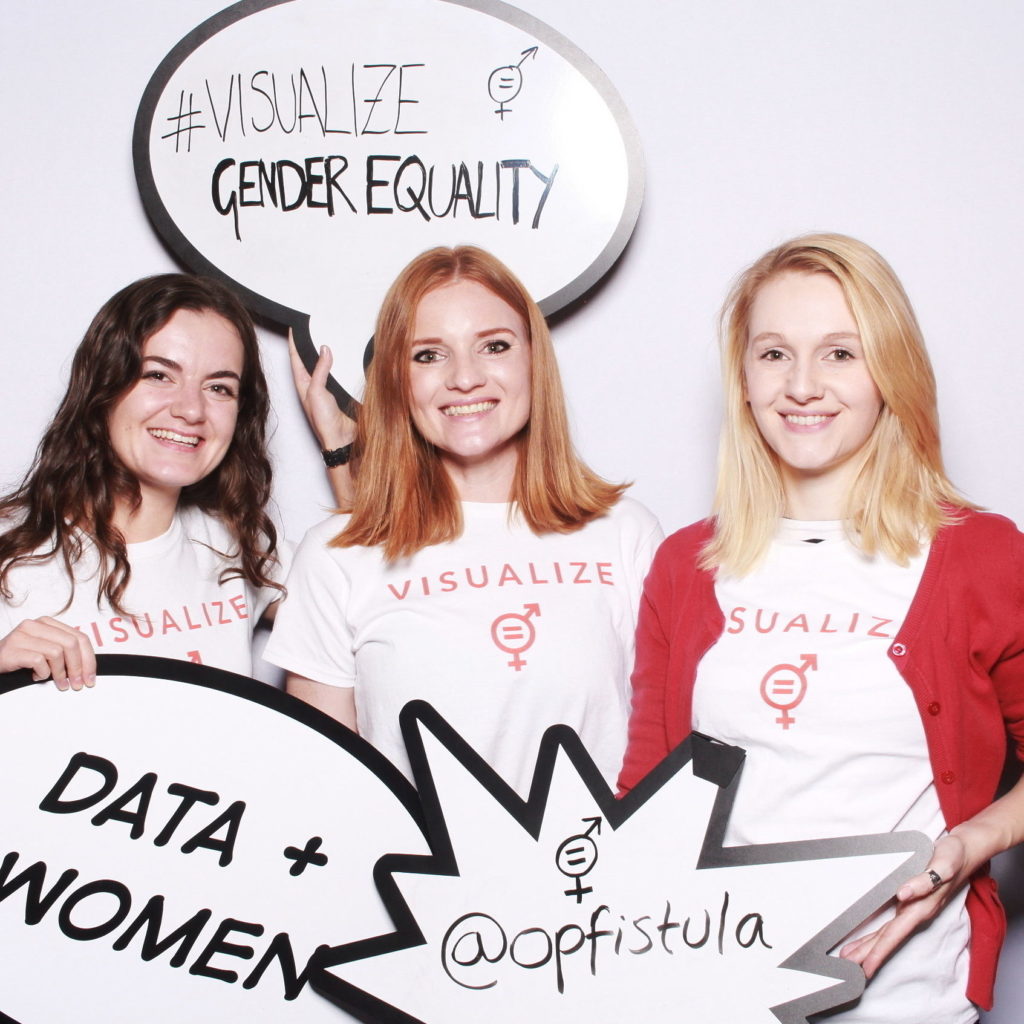
The opening remarks were made even more powerful for the Operation Fistula team, because we were at TC19 to announce the launch of our new program: Visualize Gender Equality. This program’s goal is to harness the power of data visualization to highlight gender inequality and fuel global action.
The work will kick off on International Women’s Day 2020 and be in collaboration with both Tableau Foundation and Makeover Monday. Individuals from the Tableau community will contribute data visualizations to highlight the areas of the world where the burden of gender inequality is most extreme, where action is needed most urgently. Obstetric fistula only happens in places where child marriage, FGM, gender-based violence, and other forms of extreme gender inequality occur. Not only will Visualize Gender Equality enable us to map the gender inequality that causes fistula, but also enable us to drive collaboration, advocacy, and action to end other forms of extreme gender inequality.
We announced the launch of this work at the Makeover Monday Live event which had an attendance of over 1,200 people! It was so energizing to see such a large and dynamic group engage so deeply with this initiative. We are still making our way through the incredible Tableau dashboards that were submitted during the event, but we are completely in awe of the talent and insights that we have seen so far.
We want to give a huge shout out to Eva Murray and Andy Kriebel for collaborating with us, and giving Visualize Gender Equality such a phenomenal platform at TC19. We can’t wait to work with you more, and continue getting to know the rest of the Tableau community online.
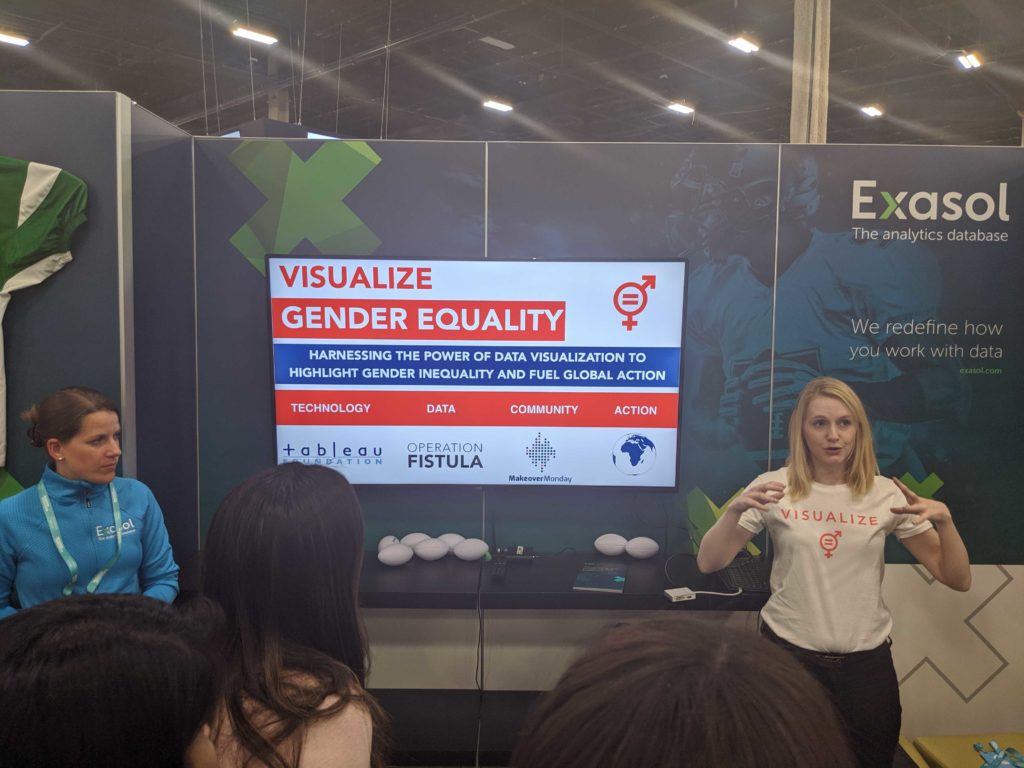
Our Analytics Manager, Naledi, had the opportunity to present on both the Visualize Gender Equality project and also on our collaboration with Mapbox. This year, Mapbox volunteers have given their time to support our FREE program with their geospatial mapping technology. With their expertise and support, we have been able to leverage the power of mapping to strengthen our efforts in patient identification and mobilization in Madagascar. The level of detail they’ve been able to reveal for us is transforming the way we are working to end fistula for every woman, everywhere!
TC19 was incredible! We met with so many inspiring people, and connected with phenomenal data-driven organizations. The whole team feels so fortunate to have been part of this inspirational community of data leaders and changemakers.
We’re gearing up for the launch of Visualize Gender Equality on International Women’s Day 2020 – reach out to us, and get involved!