Skip to content

Finding Needles in Invisible Haystacks

“When asked about snakebite statistics in Brazil, scientist Maurício Rocha e Silva once said there were none,” Deirdre Mask writes in her 2020 book The Address Book: What Street Addresses Reveal About Identity, Race, Wealth, and Power. The scientist explained his logic: “Where there are snakes, there are no statistics; and where there are statistics, there are no snakes.”
 
Rocha e Silva’s pointed comment on discrepancies within the quality of available public health data could equally be applied to the discussion of obstetric fistula.
 
In the United States, we have excellent statistics on fistula prevalence among American women. In short, there is none.* In Madagascar, there is plenty, but even a rough estimate might miss the mark by tens of thousands.
 
Where there is fistula, there are no statistics; and where there are statistics, there is no fistula. 
 
Fistula happens in places that are quite literally off the map.
A member of OpFistula’s outreach team (center) speaks with community members in Sahasinaka
Mapping as data collection
When Operation Fistula opened its Madagascar office in 2019, we knew we would need more sophisticated tools for locating potential patients. 
 
Madagascar is roughly the size of Texas, and more than 60 percent of the Malagasy population lives in the country’s expansive rural regions. The more isolated a place is, the more likely we were to find women living with fistula — women who might not even be aware treatment exists, let alone have the means to access it.
 
But there was a problem: demographic maps of Madagascar were full of holes. Entire populations existed far from paved roads, in dwellings that were invisible on official government documents. 
 
Satellite images of the regions we were targeting revealed distinct clusters of buildings. We knew that there were entire villages left unnamed and unrecognized — communities that could only be described in relation to other landmarks.
 
If our goal was to eliminate fistula in a particular place, a basic prerequisite is that we need to know what the place is called. And it’s hard to go door to door in search of patients if you have no idea where all the houses are located. 
 
Or, as OpFistula’s CEO Seth Cochran put it, “It’s like looking for a needle in a haystack, and you don’t even know where the haystacks are.”
 
Our strategy in Madagascar is built around geography. We’re going village to village — or in mapping unit terms, square by square — attempting to find every woman in need of fistula repair. By chipping away at the backlog of patients in need of care, and helping communities understand how fistula can be prevented and treated, we are aiming to create “green zones” on the map — places that are entirely fistula-free.
 
A challenge to this plan is that fistula projects are historically and notoriously hampered by a severe lack of data. As noted in the anecdote on snake bites and statistics in Brazil, if you are engaging with a population that is underserved and undercounted, you likely lack even a rudimentary database from which to build a good prevalence estimate: how many patients are there? where are they? how far do they live from a health center? what correlating patterns are visible?
 
Building new maps to guide community engagement is the methodical approach we hope will produce the concrete, reliable statistics so many projects crave.
Community Engagement Coordinator Rova Ralaindimby (second from left) consults a map of Ambalavero during a pre-deployment discussion with members of her team
Maps and addresses: a brief history
In 2021, it is almost inconceivable to think of pulling up Google Maps for directions, only to be met with an unmarked canvas.
 
Today, most people who live in cities don’t give a second thought to the notion of having an address. It is a basic function of our identity — part of a formal way for our governments to acknowledge us as citizens. We rarely think in such terms, but our addresses give us access to water, electricity, banking, money-borrowing, voting rights, and legal documents that open doors in all sorts of life-changing ways.
 
Though maps and city planning have been around for ages, formal addresses are relatively modern. A 2012 white paper assembled by the Universal Postal Union (UPU), a specialized agency of the United Nations, traced the evolution of street naming and house numbering, noting that different societies developed different systems at different times, to meet needs as they arose. 
 
“Descriptions that provide the means to locate and reach destinations have always existed in one form or another,” the authors wrote. “Since antiquity, descriptive addresses have helped people to orient themselves through references to major roads, landmarks, marketplaces and religious buildings.” As societies expanded in both size and complexity, however, high-level functionality became dependent on more complete mapping. The need for precise knowledge pushed societies to develop formal systems. 
 
To take western Europe as an example, the UPU reported that road names and building numbers were officially implemented and recognized in cities in the 19th century. It wasn’t until the latter half of the 20th century, however — well within the lifetimes of many Europeans living today — that that practice was extended to rural communities. 
 
Population growth worldwide has also contributed to the need for formal systems. In the past, when communities were smaller and more tight-knit, creative addressing often got the job done one way or another. 
 
Researching the history of the UK’s Royal Mail for her book gave Deirdre Mask insight into the colorful phrasings that were once used to deliver a letter into the hands of the intended recipient. She shared her favorite:
 

To my sister Jean,

Up the Canongate,

Down a Close,

Edinburgh.

She has a wooden leg.

Today, in Madagascar, we are accustomed to similar descriptions on our patient intake forms, with rice fields and mango trees serving as notable landmarks. Such characteristics work well for locals, but can create headaches for those who want or need to connect to the wider world beyond their immediate neighbors.
Accessibility and isolation are major challenges for many communities in Madagascar
Connecting people to rights and services
Pockets of “off-the-grid” communities remain around the globe, sometimes by choice, including in rural parts of the United States. In high-income countries, there is often a note of pride or defiance in these populations, some of which boast only hundreds or even dozens of citizens.
 
“In Bartley (pop. 224),” Mask writes of a community in West Virginia, “residents pivot directions around the old Bartley School, which burned down twenty years ago.” Being one of the select few who can parse such a code can give community members a very real sense of belonging. And nine times out of ten, that approach might be fine. Whether in rural North Dakota or a small village in Namibia, “just ask someone when you get close” is often sound advice for navigating the “last mile.”
 
And so it is tempting to see no harm in this small shunning of modernity. Must everything be searchable online in a few short keystrokes?
 
Mask prods her readers to imagine needing an ambulance in the black of night — suddenly the informal system starts to show cracks. Would our neighbors be receptive to paramedics ringing the doorbell at 3am to ask directions? Being easily findable in the midst of a cardiac arrest is a persuasive argument in favor of comprehensive mapping.
 
The same logic applies to childbirth in isolated, impoverished communities, where home birth is the norm. Women who develop a fistula during labor nearly always experience at least one of the three delays” of maternal health: delay in deciding it’s time to seek help, delay in the physical journey to a health facility, or delay in receiving adequate care once they finally arrive. 
 
The second delay is where the absence of maps and street addresses can have such an impact. Even if an ambulance could be summoned, how much time might be wasted if the driver has to continuously stop and scrutinize his route in search of the specific rice field that leads to the village in question?
Sturdy 4x4s or agile motorbikes can sometimes take our outreach teams part of the way to the communities where fistula patients are likely to be found, but nearly all journeys require the “last mile” (or sometimes the last 35km) to be completed on foot
Map use in public health
Data visualization through mapping has become a crucial component of medical care, especially in epidemiology. Perhaps the most famous linking of maps and medicine came in 1854, when John Snow plotted individual cholera cases onto a map of Soho and figured out that the deadly London outbreak could be traced to a single water pump. 
 
By the time the 2014 Ebola crisis in West Africa captured the world’s attention, high-quality digital map resources had become fully integrated into humanitarian response strategies. But health workers in rural Guinea faced a familiar challenge: the maps were bad. “In Guéckédo Prefecture, for example, 14 separate patient sites carried the same village name,” researchers wrote. “Contact checkers first had to identify the correct village and then travel to it across rural roads that were at best minimally maintained. Once identified, it was often difficult to locate homes because affected villages lacked well-codified street numbering systems.”
 
Ed Yong, who won a Pulitzer Prize for his COVID-19 coverage in The Atlantic, sought to explain the importance of accurate maps in public health responses well before the current coronavirus pandemic brought the issue into sharper focus. When Ebola flared up in the Democratic Republic of the Congo in 2018, Yong wrote about the country’s outdated maps, noting that “the position of specific villages, towns, rivers, hospitals, clinics, and other landmarks are often based on local knowledge and hand-drawn maps.” 
 
As with Madagascar, “Much of the Congo is also incredibly remote, and many villages have never been included on a digital map. Some were added based on information from the last census, which was done in 1984, using data points that often weren’t actually collected on the ground.” 
 
“I know they’re not accurate,” a cartographer told Yong, pointing to three white dots meant to represent villages, “because they’re in the middle of a lake.”
 
Beyond fixing major errors like this, accurate mapping can pinpoint where all the buildings are. And if you know where the buildings are, you can estimate population in a specified area — an endeavor that is especially important for a country that hasn’t completed a census in more than 30 years.
 
Yong’s cartographer explained: “Let’s say you have a village with 500 kids, and your estimate is that there are 100. Someone could go and say: I vaccinated 100 people so I got 100 percent of them — and they didn’t. 
 
“Alternatively, if you think there are 400 kids and there are actually just 200, half your doses are wasted, and the records will say that coverage is at just 50 percent.”
 
Again, the comparison to Madagascar is apt. In 2018, Madagascar conducted its third-ever housing and population census, which showed the country had more than doubled in size since the previous census, carried out in 1993. In just 25 years, the country had added 13 million citizens.
 
Knowing where its people are located can help a government plan and respond to real needs. And health services mapping — identifying locations and capacities of health services and facilities, and showing how to reach them — is where OpFistula’s work begins to take shape.
OpFistula Mapping Analyst Dolly Andriatsiferana (right) reviews a map of Ambalabe commune with the chief of the fokontany
Matching need with expertise
Dolly Andriatsiferana is OpFistula’s Geographic Information Systems (GIS) Analyst — our chief mapper. His innate fascination with maps started early, when he began tracing spidery lines and crisp borders on pieces of paper as a five-year-old. “When I saw maps in books, I tried to reproduce them,” he said. By the time he was ready to undertake his university studies, he was ready to commit to geography. “I simply wanted to know how to make those professional-looking maps that you see in books. So I started to look for the tools you need to use to make them.”
One of Dolly’s earliest hand-drawn maps, which depicts a fictional town he created at age 14
Dolly’s skills were immediately put to use in his native Madagascar, where disaster risk management initiatives were preparing for any number of future eventualities. “The very first thing I worked on [after university] was a project called Open Cities,” he said. It was a project that mapped every building in an area deemed vulnerable to climate change. “We mapped places that may be subject to wildfires or flooding — every building, every feature of public infrastructure, like water and sanitation, that may be vulnerable to natural disaster.”
 
It was around this time that Dolly’s public maps caught the eye of OpFistula’s CEO. Seth had been researching the utility of maps for years, including in relation to a maternal mortality project guided by the late physician and data expert Hans Rosling. “Those beautiful maps that Dolly wanted to create since childhood? They worked,” Seth said. “I just happened to stumble on a few of them one day while I was going down a data rabbit hole, and I knew I needed to meet this guy.”
 
It has now been nearly two years since Dolly joined OpFistula. In that time he has built up a team of equally enthusiastic geographers, and they have completed the mapping for three entire regions. 
 
Looking at a map from 2019 and again today, the progress is tangible. Dolly’s team has enabled more than 35,000km2 of Madagascar’s unique terrain to blossom on the (virtual) page.
OSM’s map of Madagascar, showing progress in the decade from 2011-2021. The bright white spots that emerge along the island’s east coast, starting in 2020, show OpFistula’s progress in our 3 target regions of SAVA, Vatovavy and Fitovinany.
 
OSM and the OpF mapping process
To accomplish their aims, Dolly and his team turned to OpenStreetMap (OSM), a free digital map onto which contributors from around the world may add or update data points. This global community of mappers uses satellite imagery and GPS devices to identify buildings, roads, foot paths, bodies of water, changes in terrain, and dozens of other features. The maps they create are accessible to anyone who might find them useful.
 
OpenStreetMap was founded in 2004, and gained popular notice as a resource for responding to humanitarian crises after the Haiti earthquake in 2010. In the direct aftermath of that horrific event, and again during the Nepal quake in 2015, hundreds of virtual contributors, logging on from thousands of kilometers away, raced to make first responders’ lives just a little bit easier.
 
According to Dolly, it’s the variety of mappable features on OSM that sets it apart as a database. “It’s not just a map,” he said. “There are foot paths, village boundaries, building designations — data that are very, very, very hard to get in Madagascar.” By using OSM, they build the demarcations that add up to communities that feel fully formed. “We create all that data, and because OSM is free, the data become free to everyone who needs them.”
 
That everyone” includes Apple, which began incorporating OSM data into its maps in 2012.
 
Of course, as a free database open to all users, OSM’s mapping quality varies. Dolly has seen examples of both lazy and unprofessional mapping over the years, and has worked hard to instill into his team’s ethos a pride in high-quality work. A meticulous, illustrated handbook he assembled to provide guidance on correct mapping practices is — in the spirit of OSM — also open-source and available in French and English to all interested mappers.
A preliminary map of Ambalabe commune, which OpF staff in the field will use to verify travel distances between fokontany
Putting all of Madagascar on the map
Madagascar is an enormous island — the fourth biggest in the world. It is split into 23 regions, which in turn are broken down into smaller and smaller areas. 
 
Official maps of Madagascar record some of these borders. They accurately differentiate the regions, which break down further into districts, and then into communes
 
But from there, further dissections are often not formally recorded at the national level, even though they are known and used by the populations themselves. A commune is divided into parcels of land called fokontany, and each fokontany contains a handful of villages, or hamlets.
 
For our work at the community level, these fokontany are the most relevant subdivisions, and the existing maps’ unreliable borders give us little to go on.
 
To make these fokontany and their villages come alive on the map, Dolly and his team employ a two-step process. 
 
The first part is done remotely. Squinting over satellite images from their laptops in Antananarivo, they zero in on a single square of land in OSM, then painstakingly identify each feature. They outline every building (1.5 million of them, to date), trace every road and visible foot path, label every stream, river and body of water, and capture rice fields, mountains and other changes in terrain and topography. 
 
Once this process is complete, we have the bones of the data that will allow us to efficiently plan how to travel to a chosen community. As Dolly puts it, the data communicate. When the mapping is done right, we can accurately analyze the accessibility of each location: can we get there? by what means? how long will it take? 
 
By making previously hidden building clusters appear on the map, populations become visible. We can calculate exactly how long it will take us to travel between fokontany, factoring in differences between paved roads, dirt roads, and foot paths. We can see that what appears to be the shortest distance to one community may in practice be impassable — because it is straight up a sharp and narrow incline, for instance.
A road that is suitable for a motorbike during certain months of the year may call for different planning in the rainy season
Knowing how long the travel will take influences all sorts of planning. Being prepared for car travel is different from being prepared for motorbike travel, which is different still from being prepared to trek 28km on foot in the rain. You pack different gear, and equip yourself with more cash if you know you’ll be on the road for twelve nights instead of eight. Your manager can forecast their monthly expenses with greater accuracy.
 
Looking at the bigger picture, comprehensive mapping helps us begin to make assumptions that inform our methodology. “There’s not really one single activity more essential to the work we’re doing than the mapping,” Seth said. “Not only does it guide us where to send people to find patients, but it helps us understand where those patients cluster and what other factors might be causing issues.” 
 
Dolly can run analytics, Seth said, which tell us how many structures there are in any given location. “We can make an assumption that there are two or three people per structure — that’s a population,” he said.
 
From there, we can begin to plot locations of known fistula cases, and eventually calculate a true prevalence rate. “It’s way more accurate than a census,” Seth said. “I think in ten years everyone’s going to be using maps to inform their public health work.”
An OpFistula map in progress, where important features in the village of Ambahy — like the Mayor’s office and the ferry route — are shown to scale
Giving citizens a solid identity
The second part of Dolly’s mapping process — arguably the part that transforms the activity from something useful to something meaningful — takes place in the communities themselves. When our field workers travel to a new fokontany, they start asking questions that the mappers can’t answer from their desks in Tana.
 
Our preliminary maps may have shown us where the buildings are, but it’s only by talking to the community members that we can pinpoint which building is the school, which is the health center, which is the church. 
 
It is only by walking the foot paths that we can note where cloud coverage or dense forests may have hidden a group of homes from the satellites, or learn that a bridge or a ferry can get people across a body of water that looked from above like it was isolating an entire community. 
 
And it is only by talking to people that we can ask them what this place is called. “You can’t see place names from satellites,” Dolly said. “You need to go and ask people.” 
 
Technology is a marvel. But in the end, we need human interaction. What is the name of this fokontany, which does not appear on any official map, we might ask? What is the name of the fokontany to the east? What are the names of the villages in this fokontany
 
By recording those names, up to that point used only by the people living in them, we are able to formalize an identity that until then had meant nothing to anyone living outside its borders. Short of giving people an exact address, putting their village on the map is a major step towards giving citizens a sense of belonging in their own country.
Residents of Taniady village are most easily reached by boat
“Inclusion is one of the secret weapons of street addresses,” Deirdre Mask writes in her book. Helping people feel that they are a part of society beyond their immediate environs is huge. “Without an address, you are limited to communicating only with people who know you. And it’s often people who don’t know you who can most help you.”
 
Naming streets and assigning house numbers is, of course, beyond OpFistula’s purview. But other entities are pitching in to try to close those gaps with a light touch.
 
In 2009, the UPU launched an initiative called “Addressing the world – An address for everyone,” the ultimate goal of which is to ensure that every inhabitant of Planet Earth has an address. Several interesting and non-traditional addressing projects emerged to provide an alternative to lagging government systems. In India, for instance, Google Plus Codes have proved a workable solution for the densely populated Kolkata slums.
 
Rather than trying to name the winding mazes and number the ever-morphing homes crammed into these informal settlements, Plus Codes are based on latitude and longitude, and displayed as a shorter string of numbers and letters than standard GPS. The codes work offline, and are free to create and use. Adding the codes to the doorways of people’s homes allowed residents to receive mail deliveries and open bank accounts for the first time.
 
As the benefits of becoming easily findable continue to be communicated to those previously left behind, it seems inevitable that the days are numbered for blank white spaces on digital maps.
Above are two examples of the hand-drawn maps typically found at the community level in Madagascar.

“You are here”
Earlier this year, Dolly accompanied some of our field staff on a mission to Ambalabe, a commune in the SAVA region. He was working with Rova Ralaindimby, our Community Engagement Coordinator, to test a model for verifying whether we felt confident that we’d found all the patients in need of help in these fokontany.
 
After a couple weeks of testing his own mapping efforts, and armed with a trove of data, it was time to head back to Tana. But before he left, Dolly had an idea.
 
“We realized that this was a big occasion — making a place fistula-free,” Dolly said. He knew that most people in Ambalabe would never have seen anything but a hand-drawn map of their community — nevermind such a complete rendering, where each home was visible. 
 
He and Rova decided that to celebrate the accomplishment of the community coming together to end fistula, the community members themselves should be able to hold in their hands a print-out of the detailed map produced by his team. It would be a way to show: You are here — and in all this place, there is no fistula.
 
The maps were an instant hit. “The local leaders had never seen anything quite like it,” Dolly said.

*To say that there is no fistula in the United States is an oversimplification. Fistula has been a consequence of childbirth for as long as women have been having babies. The vast majority of women who give birth in high-income countries, however, do so while under professional medical care, and thus do not experience the days-long, unsupervised labor that most of our patients endure. Because of these enormous disparities, most fistula organizations focus on fistula in low-income countries.

Acknowledgements:

Mapping in Madagascar 2020. Orange = an unmapped area
Mapping in Madagascar 2021. Purple = a mapped area

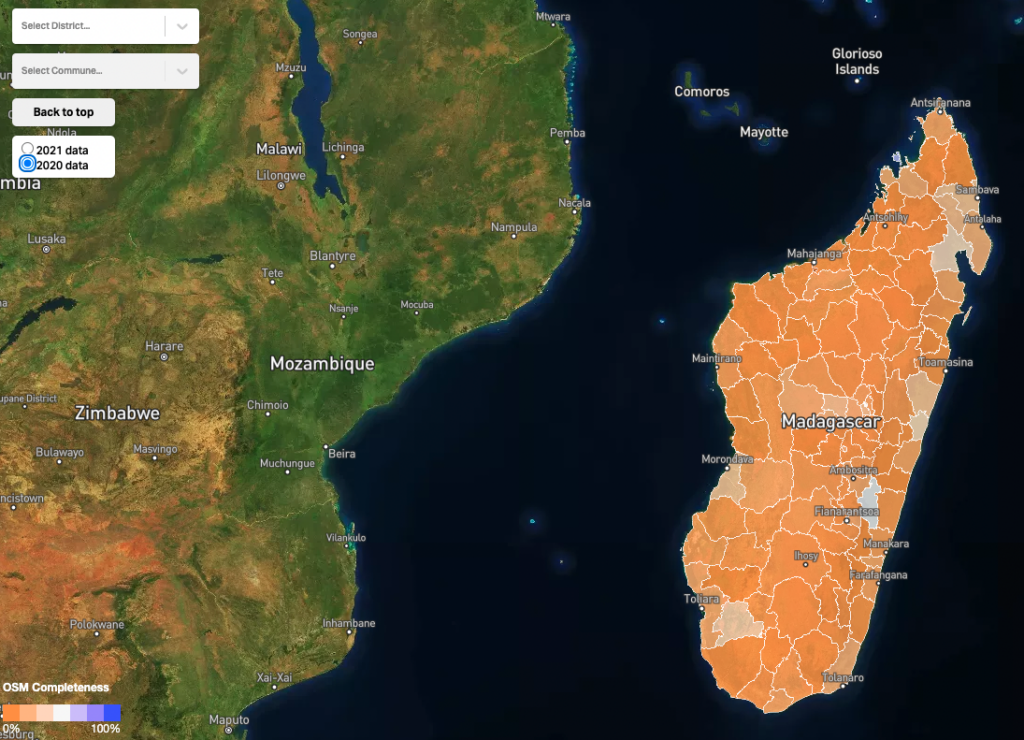
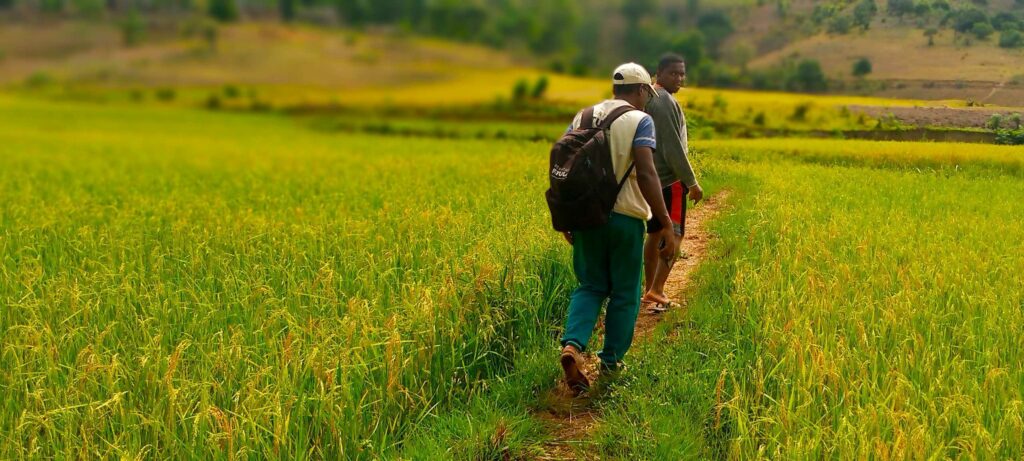
Our mapping work wouldn’t be possible without the support from our phenomenal partners at Mapbox and Thinking Machines. Their technology enables us to track Operation Fistula’s work in OSM, and also to see the progress that has been made in OSM across Madagascar. In the images above, you can see the huge strides made in the mapping of Madagascar over the two years that the OpFistula mappers have been active, and where they have focused their efforts: Vatovavy, Fitovinany, and SAVA.

en_USEnglish